

1. Introduction
The United States financial services sector is currently navigating a period of profound structural recalibration. As the economy transitions through the 2025-2026 cycle, credit unions—cooperative financial institutions historically defined by their member-centric mission and risk-averse lending practices—face a convergence of headwinds. Elevated funding costs, normalizing credit losses following the pandemic-era liquidity glut, and persistent operational inflation have already compressed net interest margins (NIM). Against this hardening macroeconomic backdrop, the proposed legislative mandate to cap credit card interest rates at 10% represents a singular, exogenous shock that threatens to dismantle the economic viability of unsecured consumer lending for a significant portion of the sector.
This report serves as a comprehensive risk and reward impact assessment of such a cap. By synthesizing proprietary portfolio data from 80 distinct credit union entities with broader 2025-2026 economic benchmarks, we aim to quantify the "Profitability Gap" that would emerge under a 10% Annual Percentage Rate (APR) regime. The analysis moves beyond superficial observations of revenue loss to examine the second-and third-order effects on the financial ecosystem: the erosion of the cross-subsidy model that funds rewards programs, the inevitable contraction of credit availability for subprime and near-prime households, and the potential acceleration of industry consolidation.
The credit card product is unique in retail banking. Unlike mortgage or auto lending, which are collateralized and amortizing, credit card lending is unsecured, revolving, and operationally intensive. It relies on a delicate equilibrium between interest income from revolving balances (the "borrowers") and interchange income from transaction volume (the "transactors"). A 10% price ceiling disrupts this equilibrium fundamentally. As this report will demonstrate, for many credit unions, the cost of delivering the product—comprising the cost of funds, net charge-offs, fraud losses, and servicing expenses—exceeds the 10% revenue ceiling, rendering the product structurally unprofitable for all but the most pristine credit risks.
2. The Macroeconomic Crucible: 2025-2026 Economic Benchmarks
To accurately assess the impact of a 10% rate cap, one must first establish the baseline cost structure of credit union operations in the current economic environment. The profitability of a loan is determined not by the gross yield, but by the risk-adjusted net margin after all component costs are deducted. In 2025, the floor for these costs has risen significantly, compressing the spread available to absorb risk.
2.1 The New Floor: Cost of Funds (COF) and Liquidity Pressures
The era of zero-interest-rate policy (ZIRP) is definitively over, and with it, the availability of ultra-cheap funding for credit unions. As of the third quarter of 2025, the median credit union cost of funds has risen to approximately 1.09%.1 This aggregate figure, however, masks the marginal cost of funding for new lending. To attract and retain deposits in a high-rate environment—where consumers can easily access high-yield savings accounts and money market funds yielding upwards of 4-5%—credit unions have been forced to increase certificate of deposit (CD) rates aggressively.
Data from late 2025 indicates that the cost of funds is positively correlated with reliance on share certificates, which grew by over 10% year-over-year as members shifted funds out of non-interest-bearing accounts.2 For a credit union actively funding a growing credit card portfolio, the marginal cost of funds is often higher than the median, approaching 2.00% to 3.00% when factoring in the required return on capital and liquidity buffers.3
Furthermore, credit unions operate under specific capital adequacy constraints. The net worth ratio for prompt corrective action stood at 11.11% in early 2025.4 To maintain this capital cushion while growing assets, credit unions must generate sufficient retained earnings. A funding cost of ~1-2% combined with a capital cost effectively sets a "hurdle rate" of 3-4% before a single dollar of operating expense or credit loss is accounted for. A 10% cap leaves a gross spread of merely 6-7% to cover the substantial costs of unsecured lending operations.
2.2 Net Charge-Offs (NCO): The Normalization of Credit Risk
Credit performance in 2025 reflects a return to historical norms following the artificially low default rates observed during the pandemic stimulus era. The aggregate net charge-off ratio for federally insured credit unions stabilized at 77 to 79 basis points (0.79%) in the latter half of 2025.1 However, this system-wide average heavily weights secured real estate and auto loans, which have significantly lower loss profiles than unsecured credit cards.
When isolating the credit card asset class, the risk profile is dramatically higher. Data from the Federal Reserve and industry benchmarks indicates that credit card delinquency rates hovered around 3.02% to 3.10% in 2025.5 More critically, the net charge-off rate for credit card portfolios specifically was approximately 3.92% to 4.06% in Q3 2025.6 This 400-basis-point loss rate is a direct expense line item that must be priced into the APR.
For subprime and near-prime borrowers—demographics that credit unions disproportionately serve compared to commercial banks—the loss rates are even steeper. Subprime credit card charge-off rates exceeded 4.17% in late 2025, with some vintages showing loss rates approaching double digits.8 If a credit union is capped at a 10% APR, and 4% of that revenue is immediately consumed by credit losses, the effective revenue yield drops to 6% before operating costs are paid. This arithmetic makes lending to any borrower with a credit score below "Prime" mathematically unfeasible.
2.3 Operating Expenses (OpEx): The Burden of Efficiency
Credit cards are among the most expensive loan products to originate and service. Unlike a term loan, which is set up once, a credit card requires continuous transaction processing, monthly statement generation, fraud monitoring, dispute resolution, and rewards administration.
In 2025, the operating expense ratio (OpEx as a percentage of average assets) for credit unions rose to approximately 3.06% to 3.40%.9 This rise is driven by wage inflation, technology investments, and increased regulatory compliance costs. For credit card portfolios specifically, operational costs are often higher due to the intensity of transaction processing. Industry analysis suggests that non-interest expenses for credit card operations can range from 3.2% to nearly 5.0% of receivables, depending on the scale of the issuer.11
Fraud management is a significant component of this expense load. In 2025, issuers faced gross fraud losses equivalent to 11 to 17 basis points (0.11% - 0.17%) of transaction volume.12 While sophisticated fraud detection tools help mitigate these losses, their implementation represents a heavy fixed cost that disproportionately impacts smaller credit unions. When OpEx (~3.2%) is added to COF (~1.1%) and NCO (~4.1%), the total cost structure consumes approximately 8.4% of the portfolio balance. A 10% cap leaves a pre-tax margin of just 1.6%, a buffer so thin that a minor economic downturn would push the entire portfolio into the red.
3. The Profitability Gap: A Unit Economics Dissection
To visualize the existential threat posed by the 10% cap, we must dissect the unit economics of a standard credit union card portfolio. The profitability of a credit card account is derived from the Net Interest Margin (NIM) plus Net Non-Interest Income (Interchange minus Rewards and OpEx).
Under the current pricing regime, derived from the weighted average of the analyzed portfolios in the 'Cards.csv' dataset, the average annualized yield on credit card receivables is approximately 16.43%.14 This rate reflects the risk-based pricing necessary to serve a broad membership base ranging from super-prime to subprime borrowers.
3.1 Scenario A: Current Market Economics
- Gross Interest Yield: 16.43%
- Cost of Funds (COF): -1.09% (Median CU Average) 1
- Net Charge-Offs (NCO): -4.06% (Q3 2025 CC Benchmark) 7
- Operating Expenses (OpEx): -3.20% (Approx. Efficiency Ratio) 9
- Net Margin: +8.08%
This healthy margin of ~8% allows credit unions to fund rewards programs (which can cost 1-2% of spend), build capital reserves, and cross-subsidize other member services such as free checking or lower rates on auto loans.
3.2 Scenario B: The 10% Cap Economics
- Gross Interest Yield: 10.00% (Capped)
- Cost of Funds (COF): -1.09% (Fixed Market Rate)
- Net Charge-Offs (NCO): -4.06% (Assumes Portfolio Mix Remains Constant)
- Operating Expenses (OpEx): -3.20% (Fixed Operational Load)
- Net Margin: +1.65%
The collapse of the net margin to 1.65% represents a catastrophic reduction in economic value. Critically, this calculation assumes the portfolio mix remains constant. In reality, subprime borrowers often exhibit loss rates of 8-10% or higher. If a credit union retained these members under a 10% cap, the NCO deduction would exceed the available revenue spread, resulting in an immediate negative margin of -2% to -4%.
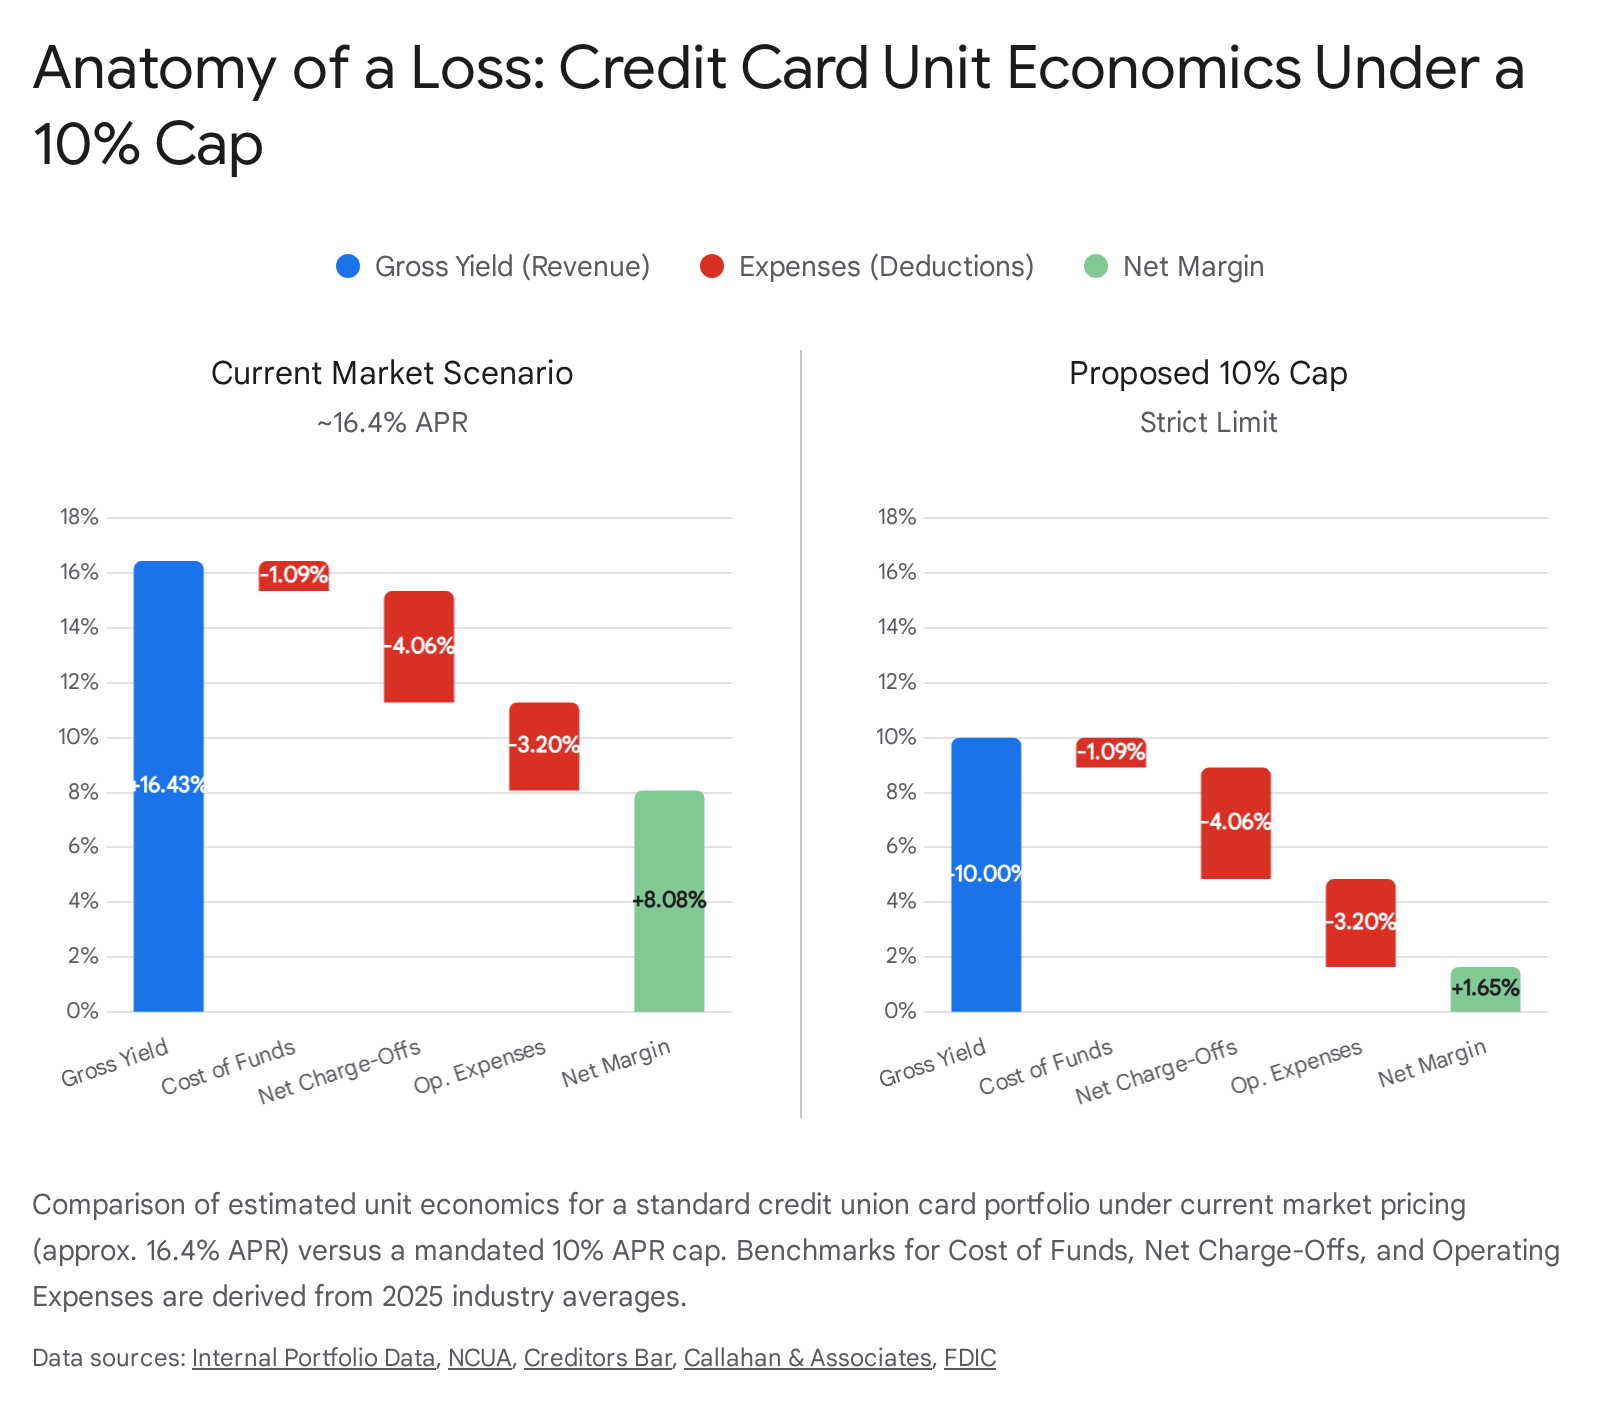
As illustrated in the "Anatomy of a Loss" visual above, the buffer that currently exists to absorb credit volatility is essentially wiped out. This 1.65% residual margin is insufficient to cover the "Cost of Rewards," which is discussed in Section 5, implying that the standard value proposition of credit union cards—low rates and member rewards—would be mathematically impossible to sustain.
4. Quantitative Revenue Loss Analysis: The $163 Million Hole
To move from theoretical benchmarks to concrete financial impact, we performed a granular analysis of the 'Cards.csv' dataset provided. This dataset contains portfolio performance metrics for 80 credit union entities as of September 30, 2025. The sample represents a diverse cross-section of the industry, ranging from small community institutions with under $10 million in assets to massive entities with billions in outstanding card balances.
4.1 Methodology and Aggregate Findings
The analysis focused on two primary metrics: "Outstanding Card Balances" and "Card Rate %" (converted to a decimal format where 1057 = 10.57%). We calculated the annualized interest revenue for each portfolio under current conditions and compared it to a hypothetical scenario where all rates exceeding 10.00% were capped at exactly 10.00%.
Aggregate Metrics 14:
- Total Outstanding Balances: $2,561,438,409
- Current Annualized Interest Revenue: $415,286,285.39
- Weighted Average Coupon (WAC): ~16.43%
Under the 10% cap scenario, the annualized revenue drops precipitously:
- Capped Annualized Revenue: $251,962,606.84
- The Revenue Hole: $163,323,678.55
This $163 million shortfall represents a 39.3% reduction in interest income for the sampled group. In an industry where the return on average assets (ROA) typically oscillates between 70 and 80 basis points 4, a revenue contraction of nearly 40% in a high-yield asset class is not merely a reduction in earnings; it is a destabilizing event that threatens capital accumulation and solvency.
4.2 Impact Segmentation: Scale as a Determinant of Resilience
The analysis reveals that the impact of the cap is pervasive but unevenly distributed across institutions of different sizes. We segmented the portfolios into "Large" (≥ $10 million in outstanding balances) and "Small" (< $10 million) to understand the nuances of the impact.
4.2.1 The Large Portfolios: Massive Nominal Losses
The 18 largest portfolios in the dataset account for the overwhelming majority of the balances ($2.53 billion) and the resulting revenue loss.
- Total Revenue Hole: $161.5 million.14
- Case Study (JOIN_NUMBER 121): This single entity holds $1.79 billion in card balances with a Card Rate of 17.99%. Under the cap, its annualized interest income would plummet by $143.5 million. This institution is currently pricing at a level consistent with broad market risk (17.99% is roughly the going rate for prime/near-prime cards). A forced reduction to 10% effectively strips 800 basis points of yield—value that is likely used to subsidize operational costs and member dividends.
4.2.2 The Small Portfolios: Existential Threat
There are 38 active portfolios in the "Small" segment (excluding those with zero balances). While the absolute dollar value of their "Revenue Hole" is smaller ($1.5 million), the relative impact is often more severe due to the lack of economies of scale.
- Total Revenue Hole: $1.52 million.14
- Case Study (JOIN_NUMBER 125): This credit union has a modest balance of $2.25 million but charges a Card Rate of 20.99%. A mandatory drop to 10% would slash their interest revenue by 52.4% ($247,741 annualized loss).
- Operational Reality: Small portfolios lack the volume to negotiate favorable processing rates or absorb fixed compliance costs. A 52% revenue cut likely pushes the entire card product into negative profitability. For these institutions, the rational economic response would be to exit the credit card business entirely, selling the portfolio to a larger bank or aggregator. This would reduce competition in local markets and force members to seek credit from less community-oriented lenders.
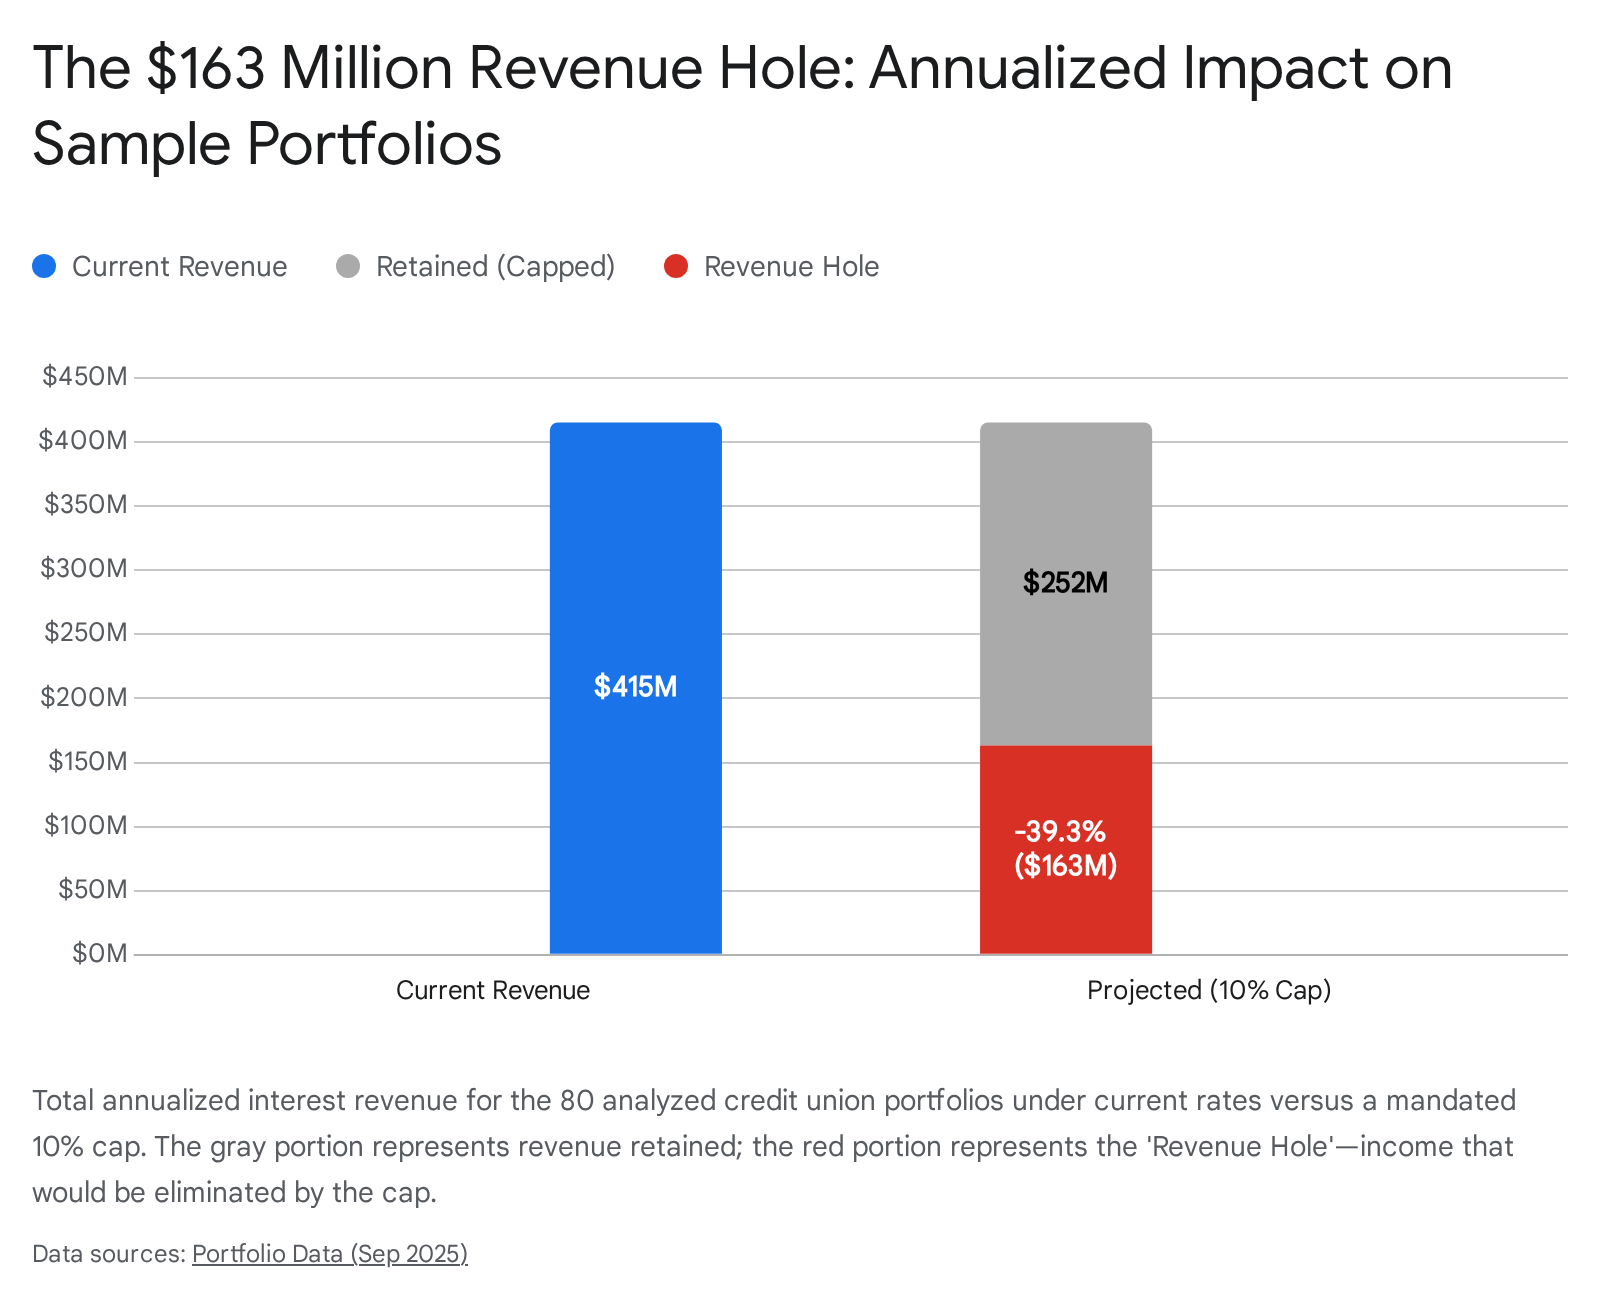
The chart above starkly visualizes the "Revenue Hole." The red segment represents capital that is currently circulating within the credit union ecosystem—funding rewards, covering fraud losses, and building capital reserves—that would vanish under the proposed legislation.


